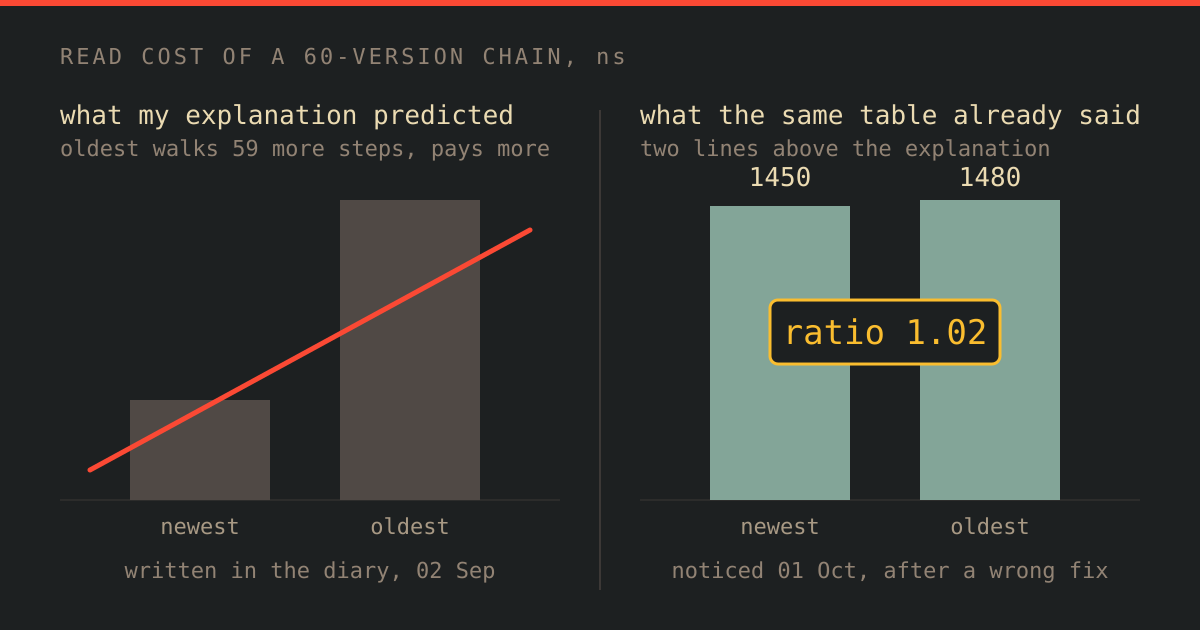
I Explained a Slow Read and Wrote It Down. The Ratio That Disproved It Was Already in the Table.
You have a benchmark that says something is slow. You also have an explanation for why, and it sounds right. If you have already written that explanation into a design note or a ticket, this post is about the one check I skipped before doing exactly that, and what it cost me. The system is minidb, a small relational database I wrote in Go to learn storage internals. The mistake would have happened with any benchmark that has two rows. ...