Somewhere in a design document you have signed off on, there is a sentence of the form “when it passes X, we will do Y.” Has anyone ever generated X rows to check that the number means what it says?
At the end of last month I signed off on a design that runs a lookup against a column with no index, on a table my team does not own, and wrote the condition for fixing it as a sentence with two numbers in it: “when the table passes about 1,000,000 rows or the p95 of the voucher filter passes 300 ms, request a non-unique index from the owning team.” The sentence had one job: get the option “ship without the index” through design review, with “we will add it later” turned into something a reviewer could sign. It did that job.
This week I built a bench to check the numbers. The row-count clause is off by a factor of 15 on one MariaDB version and about 100 on another. The decision to defer the index still stands. The numbers I attached to it do not, and this post is about how those numbers got written.
Dissecting it: where the two numbers came from
The feature was small: a text box on the order list that finds orders containing a given voucher. Vouchers live in a table that belongs to another system, maintained by another team. Our admin portal reads it and cannot migrate it. There are two kinds of voucher code in two columns, and neither column had an index.
The threshold came before the measurement. By the time the design reached me, the analysis phase had already recorded the shape of the decision: ship without a new index, and write down an escalation trigger of about 1M rows or 300 ms p95. My job was to get that option through review. That meant showing the two alternatives were worse, and showing the trigger was more than a promise.
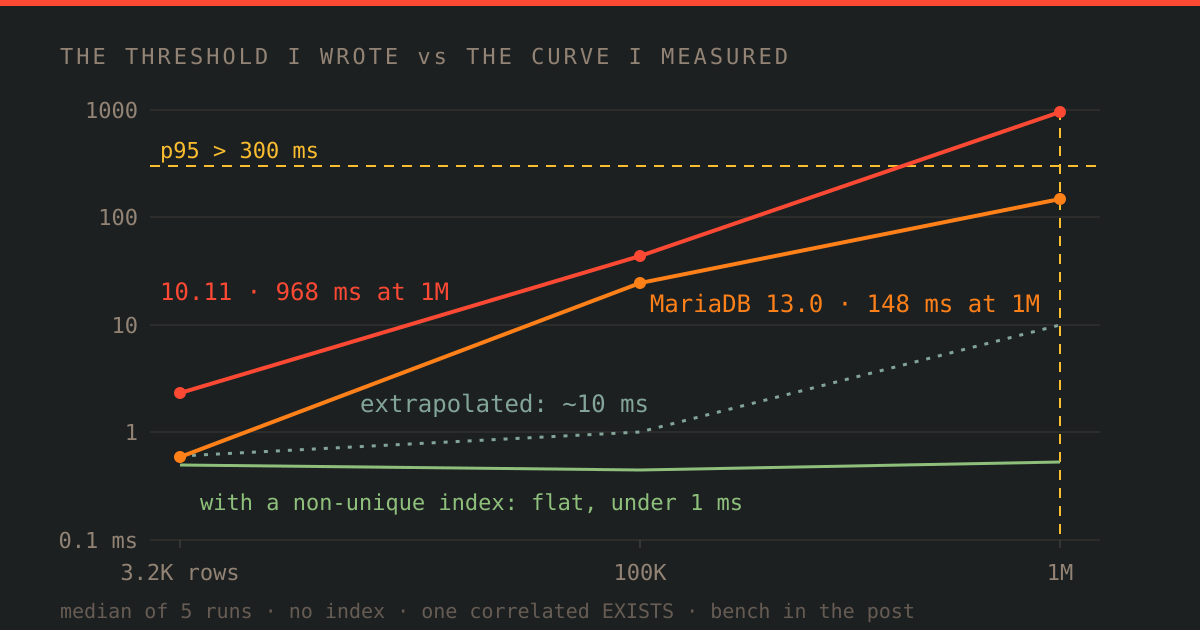
So I ran one EXPLAIN on staging: 3,217 rows, about 2.14 vouchers per order, full scan under 1 ms. Then I drew a straight line through that one point. About 1 ms at 100,000 rows, about 10 ms at 1,000,000. The design document calls that line “the basis” for the trigger. It was the other way round. The 1M figure was already in the record; the line was drawn afterwards to give it a footing. I did not run the query at 100K rows. I did not run it at 1M. The staging number was real; the line through it was a guess with two decimal places.
The 300 ms half has no line at all. Nothing in the record says why 300 and not 200 or 500. It sounded reasonable, and nothing in the record shows anyone, me included, asking where it came from.
This is also why nobody measured later. Once the review passed, the number had nothing left to do, so nobody went back to it. No one scheduled a re-measurement. The one open item that would have settled the question, a row count on the production table, is still open in the handoff notes.
Two smaller decisions were made in the same design, and one of them comes back at the end.
- The 10-digit code looks like a number, and the obvious validation is numeric. A count on staging said 9.8% of codes start with a zero. Cast one to an integer and the zero is gone, the query returns nothing, and no error is raised. About one search in ten would fail silently. So the code is a string end to end: regex validation, no cast at any layer, and the exported spreadsheet column typed as text so the spreadsheet does not strip the zero either.
- You do not know which column the user typed, and the obvious query is an
ORacross both. But the two formats never overlap: one is exactly 10 digits, the other exactly 11 characters and always contains a letter. So a single value object parses the raw input and returns exactly one (column, value) pair or nothing, and all three places that filter (order grid, sub-order grid, export) call it. The recorded reason for not usingORwas that with no index it forces a full scan. In my head there was a second reason, never written down: thatORacross two columns would stay hard to index later.
Trade-offs
Three options were recorded at the time, and the record keeps all three.
- Ship without the index, write the escalation trigger as numbers. Chosen. It respects the ownership boundary and blocks nobody. The cost is that the query’s price grows with the table, and if the trigger is not written down, it will be forgotten. The trigger has two clauses joined by or because a row count is easy to check and latency is what users notice.
- Add the index with a migration in our own repo. Rejected. Fast, and not ours to do: we have no rights on that schema, and a migration in our repo would drift from the owning system’s.
- Block the ticket until the other team adds the index. Rejected. That is where this should end up, but it holds a low-risk change hostage to another team’s backlog for a benefit that, at 3,217 rows, was not measurable.
Two smaller choices sat inside the first option. The request would be for a non-unique index, because a uniqueness constraint could break the owning system’s insert or retry path, and that path is not mine to reason about. And the trigger would be written into the design record rather than remembered.
I still think the first option was right. What I would change is the numbers I attached to it, and the order in which the number and the measurement were made.
What changed, measured
The bench is at bench/khong-them-index-viet-nguong-leo-thang-thanh-so. One command, Docker only, about two minutes per version.
- Data: two tables with generic names, filled from MariaDB’s sequence engine at about 2.14 vouchers per order.
- Query: one correlated
EXISTSlookup, the same query form the order grid uses. - Timing: five runs per variant, each against a different existing voucher, timed on the server with
SYSDATE(6); the table shows the median.
Milliseconds, by row count in the voucher table:
| Variant | 3,217 | 100,000 | 1,000,000 |
|---|---|---|---|
| MariaDB 13.0.2, no index | 0.589 | 24.797 | 147.656 |
| MariaDB 13.0.2, non-unique index | 0.125 | 0.093 | 0.204 |
MariaDB 13.0.2, OR both columns, both indexed | 0.167 | 0.330 | 0.565 |
| MariaDB 10.11.18, no index | 2.319 | 44.279 | 967.945 |
| MariaDB 10.11.18, non-unique index | 0.426 | 0.503 | 0.622 |
MariaDB 10.11.18, OR both columns, both indexed | 0.561 | 0.523 | 0.454 |
The first number I doubted was not the 148 ms. Four passes at 1M rows on 13.0, each the median of five runs, came out at 148, 485, 162 and 129 ms, and the 485 was the one that looked wrong. The note beside it says another CPU-heavy process was running at the time, and the other three sit between 129 and 162, so I kept the 148. Then I checked that the bench query has the same EXISTS shape as the order grid’s query, not an easier or a harder one. It does. Then I redid the arithmetic: 148 against 10, 968 against 10, 22x from 100K to 1M. Only after that did I think about production, and the first thing I thought was that I do not know which MariaDB version runs there.
Three things in that table contradict what I had written.
- The extrapolation is wrong on both versions. The under-1 ms staging number reproduces on 13.0 (0.6 ms) and not on 10.11 (2.3 ms). Growth is not 1 ms per 100K rows. The first 100K rows cost about 25 ms on 13.0 and 44 ms on 10.11. Past that, 13.0 grows slower than linear and 10.11 faster: from 100K to 1M, 10x the rows costs 22x the time. My “about 10 ms at 1M” is 148 ms on one version and 968 ms on the other.
- The two clauses of the trigger do not agree with each other. On 13.0 with the machine otherwise idle, 1M rows is roughly 130 to 160 ms across three passes, so the row-count clause fires first and the 300 ms clause is slack. One of the four passes, made while another process was loading the CPU, came out at 485 ms: the same table, the same version, and now the latency clause fires first. On 10.11, 300 ms is crossed somewhere between 100K and 1M rows: about 680K extending the 100K point, about 310K extending the 1M point, and the bench did not measure in between. Either way, on that version the row-count clause fires late, only the latency clause protects users, and no one was assigned to watch it.
- The recorded reason for rejecting
ORholds; the unrecorded one does not. No index means a full scan, and the bench does not dispute that. But with both columns indexed, both versions plan an index-merge union and stay under 1 ms at 1M rows. The value object that picks one column by string shape is still a reasonable design, because one predicate hitting one index does not depend on the optimizer merging anything. But “hard to index later” was not true, and it shaped the design without ever being written down where someone could challenge it.
The non-unique index removes the growth entirely: flat between 0.1 and 0.6 ms across all three table sizes, on both versions. Nothing got worse in the bench, because the bench does not measure writes; the cost of the index on the owning system’s insert path is the one thing about it I still cannot see.
Limits, and what I would do differently
- The production row count is still unmeasured. From where I sit there is no way to query that table in production. If it is already near 1M rows, every paragraph above is moot on release day. That is the same open item it was a month ago, and it should have been the first thing I escalated, not the last.
- The production MariaDB version is unknown to me. I found nothing in the portal’s repository that pins a MariaDB version, and the database does not run inside the application’s Docker setup. Two versions are in the table precisely because the 1M result differs 6.5x between them, and I cannot tell you which of the two rows is yours.
- Every number in the table is an in-memory scan on an otherwise idle laptop. One million rows of this schema fit in the default buffer pool. A production table that does not fit is slower than any number here, and the bench runs one query at a time, so its p95 is not a loaded system’s p95. The 485 ms pass above is a hint of how much a busy host moves the no-index number.
- The export path is not benchmarked. It applies the same predicate once per chunk, so its cost is this number times the number of chunks.
- The staging figures (3,217 rows, 9.8% leading zeros, 2.14 per order) come from a private codebase. You cannot rerun those. Discount them accordingly; the bench is the part you can check.
What I would do differently is small and specific. The next time I write a threshold in rows, I will generate that many rows first: the bench that does it is one SQL file and one shell script, two minutes per version, and it needs nothing beyond Docker. Where a number is inherited rather than measured, say so in the record, instead of drawing a line through it afterwards to prop it up. A number with no origin, like the 300 ms, should be marked as a placeholder until someone measures it. I would also write the trigger with the latency clause first and the row count second, because the row count was the clause I was sure about, and it is the one that turned out to be version-dependent. And I would write down every reason a design leans on, including the ones that feel too obvious to record, so that someone who was not part of the discussion can check each one later.
The sentence with two numbers in it is still better than “add the index later.” But I did not extrapolate to find out the answer — I extrapolated to defend a number that was already decided.