You have a benchmark that says something is slow. You also have an explanation for why, and it sounds right. If you have already written that explanation into a design note or a ticket, this post is about the one check I skipped before doing exactly that, and what it cost me.
The system is minidb, a small relational database I wrote in Go to learn storage internals. The mistake would have happened with any benchmark that has two rows.
The question
minidb keeps every version of a row inside one record, newest first. A long-running reader stops old versions from being cleaned up, so the chain grows, and every read of that key has to deal with it. On 2026-09-02 I measured the effect:
| chain depth | reader | ns per read |
|---|---|---|
| 1 | newest snapshot | 171 |
| 60 | newest snapshot | 1450 |
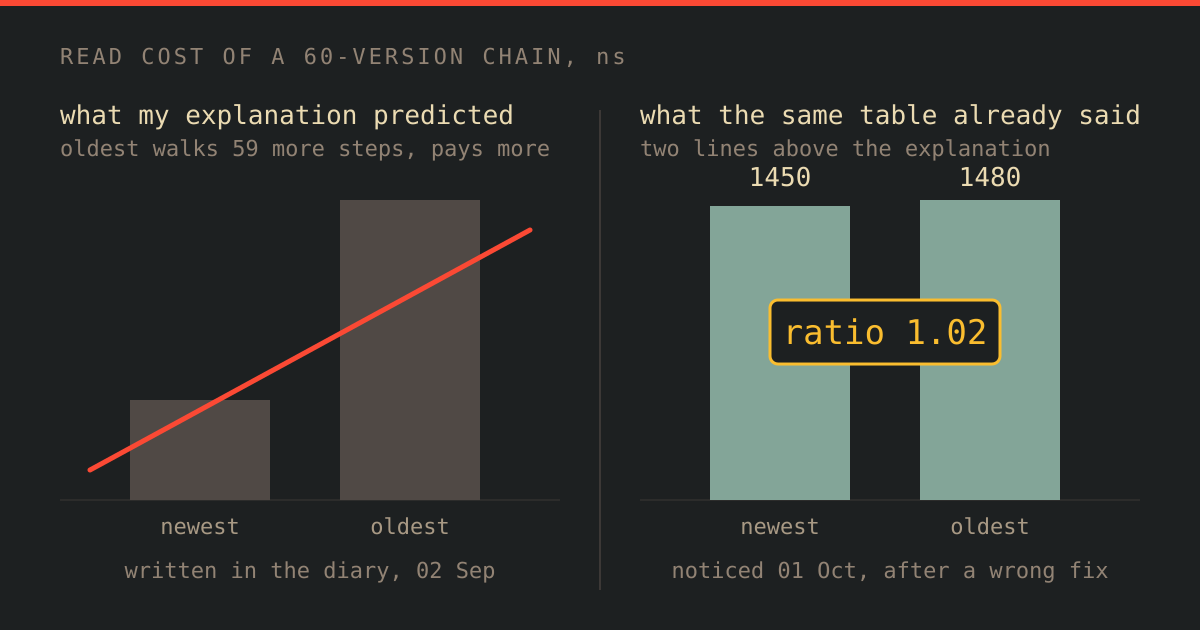
| 60 | oldest snapshot | 1480 |
Depth 60 was 8.5x slower than depth 1. The question with a decision attached: where does that 8.5x come from, so that the fix goes to the right place? Two candidates:
- Walking and decoding the chain. Then a reader whose snapshot needs the last version should pay noticeably more than one that needs the first.
- Something done once per read regardless of which version is wanted. Then both readers pay the same.
Look at the table again. oldest / newest = 1480 / 1450 = 1.02. (My diary recorded it as 0.98, dividing upside down; either way, the two readers cost the same.) The data already answered the question. I did not read it that way.
What I believed, and for how long
My explanation on 2026-09-02: the decoder builds the entire chain into an array before anyone asks which version is needed, so every reader pays for all 60. The fix would be lazy decoding. I wrote this into the project diary as the cause, and on 2026-09-29 I repeated it in a blog post about long transactions.
To be fair to past me, I also wrote a prediction next to it:
After the fix,
newestat depth 60 should drop towardnewestat depth 1, andoldestshould stay where it is. If both drop, the benchmark is measuring something else.
That prediction is the only part of the entry that turned out to be worth anything. It is also inconsistent with the 1.02 ratio two lines above it, and I did not notice for four weeks.
Method
Everything below comes from two Go benchmarks in the public repo, and a paired A/B harness in bench/cho-cham-khong-nam-o-cho-ban-doan-cap-phat-khong-phai-giai-ma that clones the repo at three commits: before, after fix 1, after fix 2.
BenchmarkGetChainDepth: one key with 1 or 60 versions, read by a fresh snapshot and by a snapshot older than the whole chain. 200,000 to 300,000 iterations, with allocation counts.BenchmarkCopyVsAlloc: copy 897 bytes into an existing buffer, versus allocate a new 1 KB slice and then copy. Five runs in the clean re-run; my own run on 2026-10-01 did not record a run count.- Paired runs. The machine was a laptop under WSL2 with two background processes eating most of four cores. Single numbers moved by tens of percent between minutes. So the before and after builds run alternately, 10 pairs, and I report the median and quartiles of the per-pair ratio. If the interquartile range crosses 1.0, the result is “no difference detected”.
./run.sh 10 # Go 1.26+, git, no Docker, about 1.5 min; prints per-pair ratios at the end
Raw numbers
Fix 1, 2026-10-01: lazy decoding, exactly as prescribed. A new function walks the chain bytes directly and builds no array.
| depth 60 | newest | oldest |
|---|---|---|
| after fix 1 | 2125–2211 ns | 2355–2640 ns |
Absolute numbers are higher because the machine was busier that day. Both columns were measured in the same run, so the comparison holds. They are still equal. I had removed the thing my hypothesis called the culprit, and the gap the hypothesis said would open did not open. (The clean re-run in the bench directory puts a number on fix 1: both readers got about a quarter faster, 0.77 and 0.75, and allocation per read fell from 3585 to 897 bytes. Equal before, equal after.)
Profile of depth=60/newest, same day:
BenchmarkGetChainDepth/depth=60/newest   300000   5520 ns/op   897 B/op   2 allocs/op

     1.50s  txn.(*Txn).Get
     0.84s    txn.VisibleRaw              56%
     0.43s      txn.(*chainReader).next
     0.64s    db.(*DB).Get                43%
     0.51s      runtime.memmove
Suspicious line. memmove charged 0.51 s for 300,000 copies of 897 bytes: 1.7 µs per copy. Memory bandwidth says a 900-byte copy should be tens of nanoseconds. So I measured the two things the profiler had merged:
| ns/op | allocs/op | |
|---|---|---|
| copy 897 B into an existing buffer | 18–25 | 0 |
make 1 KB, then copy | 890–1865 | 1 |
Fix 2, after the profile. Two changes:
- The B+Tree gives callers a view into the page while it is pinned, that is, held in the buffer pool so it cannot be evicted. It no longer copies the whole value out.
- The chain walker reads three header fields per version. It no longer builds a full version struct for each of the 60.
| before | after | after/before, median [Q1, Q3] | |
|---|---|---|---|
| depth=1 newest | 348 ns | 299 ns | 0.85 [0.80, 0.88] |
| depth=60 newest | 5213 ns | 708 ns | 0.14 [0.13, 0.16] |
| depth=60 oldest | 3878 ns | 714 ns | 0.18 [0.17, 0.19] |
| bytes allocated per read, depth 60 | 3585 | 4 |
The “before” column is the 2026-09-02 code rebuilt and re-run on 2026-10-01 on the same busy machine. That is why depth 1 reads 348 ns here and 171 ns in the first table. Only the within-pair ratios are comparable. The allocation row comes from the clean re-run in the bench directory, not from my diary, which recorded 897 for the “before” column by mistake; 897 is the figure after fix 1. The 3585 bytes are, roughly, the whole-chain copy plus the decoded array, rounded up by the allocator’s size classes.
Interpretation
The profile had two entries, and neither was “finding the visible version”:
- 43% in the tree lookup, almost all of it in
memmove. The tree returned a value by allocating a fresh slice and copying the whole 897-byte chain into it. It has to copy, because bytes inside a page can belong to a different page the moment the buffer pool evicts it. The caller wanted 3 of those bytes (the benchmark’s values are three-byte strings likev59). - 56% in the chain walker. A line-level listing of it (
pprof -list) charges 490 of its 640 ms to a singlereturn v, nil. The walker constructed a full version struct for every one of the 60 versions, so that the loop outside could read one field and discard it.
Both costs scale with depth. Both are paid on every read, whether the snapshot wants the first version or the last. That is why newest and oldest were equal on 2026-09-02, after fix 1, and on all three commits in the clean re-run.
The 1.7 µs “copy” was an allocation. The profiler attributes the cost to whoever touches the new memory first, and that was memmove. A five-line benchmark separated what the profiler had fused.
Rereading the prediction: both readers dropped, 5 to 7 times. By my own rule, the benchmark was measuring something else. The benchmark was fine. The model was wrong: I had assumed the cost was in understanding the chain, and it was in moving and materializing it.
Depth 60 is still 2.4x depth 1. I attribute that remaining cost to the walk to the end of the chain, which I kept on purpose so that a corrupted tail fails on the first read that touches it rather than waiting for an old reader. A fuzz test compares the new walker with the old one at every snapshot; when I planted an early-exit bug, it caught it in 0.08 seconds.
Trade-offs
- A view instead of a copy is a contract about lifetime: the slice is valid only inside the callback, while the page is pinned. Hold it longer and you read another page’s bytes, and nothing tells you. The old API was slow and safe; the new one is fast and has a rule you can break silently.
- Keeping the tail check costs 2.4x on deep chains. Dropping it would make reads faster and corruption detection later. I chose detection.
- Paired runs cost twice the wall-clock time of a single comparison. On a quiet machine they are unnecessary; on this one they were the difference between a number and a guess.
Limits of the measurement
- Allocation cost is a property of the kernel, not the code. On WSL2 an allocation plus copy was 890–1865 ns, about 50x the copy, and with page faults turned off it still cost about 550 ns. On bare Linux (Ryzen 7 H 255, same date) it was 154–193 ns, about 7x. The qualitative claim survived; the magnitude did not. Quote the ratio.
- No disk, one goroutine. Everything fits in the buffer pool. Pin contention is not exercised.
- Reproduced once, in a container, on the same kind of host.
run.shin a cleangolang:1.26image on a WSL2 host, 10 pairs: before the fixoldest / newest= 1.03, after the fix both readers at 0.21 of before, depth 60 still 2.2x depth 1. Same finding, milder ratios than my 0.14 / 0.18. A bare-Linux row is still missing. - What would reverse it: a layout that stores old versions elsewhere (an undo log, a separate page) removes the copy-the-chain cost by design. Then the depth cost that remains really would be pointer chasing, and the 2026-09-02 explanation would be right for that system. It was wrong for this one.
What I do differently now
The prediction saved me, but only a month late. What would have saved me that month is cheaper: before writing a cause into the diary, check whether the numbers already in the table agree with it. A 1.02 ratio between two readers that my story said should differ was not a subtlety. It was the answer, one line above the wrong one.
I explained a number with a story that sounded right and wrote the story down as fact, while the ratio that disproved it had been sitting next to it from the start.