Somewhere in your monitoring there is a panel built on a status counter you picked because of its name. Maybe the query came from a dashboard written for another database, or for another fork of the same one. Have you ever sampled that counter by hand, next to one you already understand, to check that the two move the way you think?
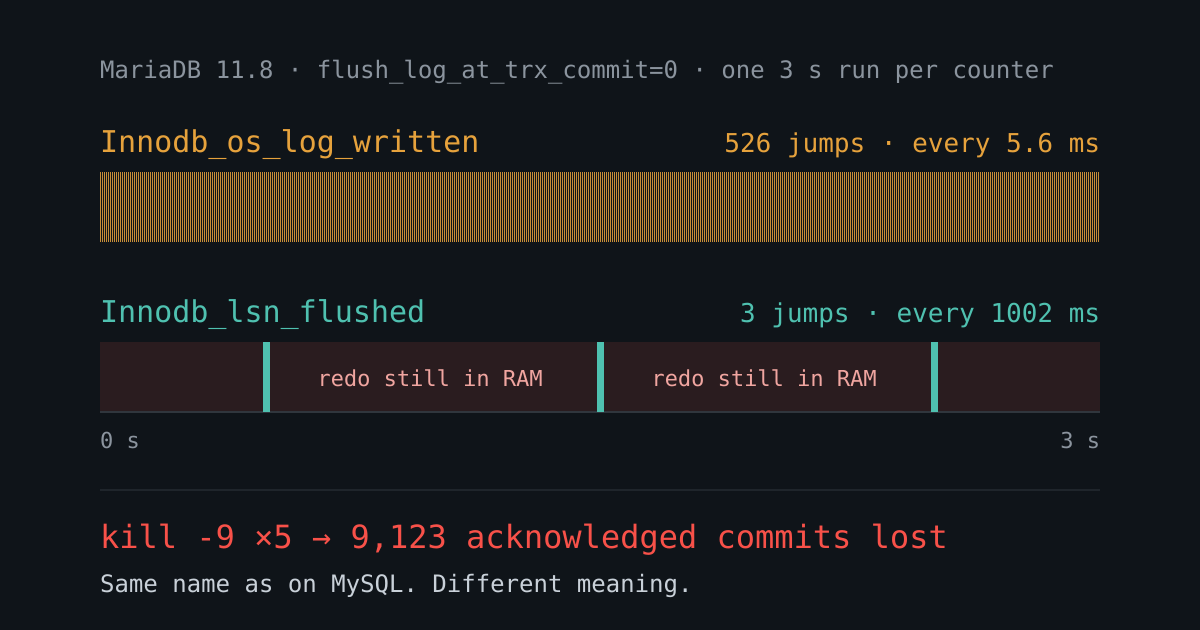
I picked Innodb_os_log_written for a measurement because its name says exactly what I wanted: bytes of redo log written. On MySQL 8.4 it agreed with the crash results. On MariaDB 11.8 it said the redo log left the process every 5.6 ms. A crash test on the same server, earlier that day, had lost 9,123 acknowledged commits, which only happens if the log sits in memory for most of a second. I had measured both numbers myself, and they could not both be true.
The question
With innodb_flush_log_at_trx_commit = 0, a commit returns without waiting for the redo log. MySQL’s manual says that when logs are flushed once per second, “up to one second of transactions can be lost in a crash”. My crash test (kill -9, five rounds per mode) disagreed by a wide margin:
mode                                        acked     lost
MariaDB 11.8, flush_log_at_trx_commit=0     43427     9123
MySQL 8.4,    =0 + sync_binlog=0            24339        6
Same engine family, same setting. As a share of acknowledged commits that is 21% against 0.025%, about 850 times apart (separate runs, so read it as an order of magnitude).
To see why, you need the path a redo byte takes before it is safe:
- Log buffer: memory inside the database process.
- OS page cache: reached by
write(); survives the process dying. - Disk: reached by
fsync(); survives the machine dying.
kill -9 erases only the first. So the loss per kill depends on one thing: how long since the last write(). The question became: at =0, how often does each server call write() on its redo log?
Method
- Setup: MySQL 8.4 and MariaDB 11.8 in Docker on WSL2, i5-1235U. MySQL runs with
innodb_flush_method=fsyncandinnodb_use_native_aio=0. Absolute times on this machine are noisy; only ratios between modes are worth trusting. - Load: one connection inserts continuously, one commit per statement, 3 seconds per mode.
- Probe: a second connection reads a redo counter every 5 ms and records each jump. The gap between jumps is the loss window. 5 ms is the floor: anything faster shows up as about 6 ms.
- Prediction: expected loss per kill =
rate × Σg² / (2·Σg). A kill lands in a gap of length g with probability proportional to g, and on average loses the commits of half that gap,rate × g/2. - Check: kill -9 after 1-3 seconds of writes, five rounds per mode, restart, count acknowledged ids that are missing.
The numbers below come from the original runs, recorded in diary/phase9.md (tables 6 and 7) with the code in reallab/. A standalone rerun that needs only Docker is in bench/bo-dem-cung-ten-khac-nghia-mariadb-dem-ca-buffer. It reproduces the counter finding, and the gap between MySQL with its writer thread (single-digit losses) and the other two modes (thousands). Exact counts, and which of those two loses more, change from run to run:
./run.sh lograte      # counters every 5 ms, 3 s per mode
./run.sh crash 5      # kill -9, 5 rounds per mode
Raw numbers
First pass, Innodb_os_log_written on both servers:
db      mode                                      commit/s  jumps  gap p50  gap max
mysql   =0 + sync_binlog=0                            4077    514    5.8ms    7.2ms
mysql   =0 + sync_binlog=0 + log_writer=OFF           4194      8  172.8ms  826.9ms
maria   flush_log_at_trx_commit=0                     4366    526    5.6ms    7.4ms
MySQL matched the expectation. MariaDB also showed a write every 5.6 ms: the contradiction from the opening. I suspected the probe first and sampled by hand while MariaDB took inserts:
lsn_current 3602546893  lsn_flushed 3601694282  os_log_written 3789950  t=38.077
lsn_current 3603397116  lsn_flushed 3601694282  os_log_written 4640173  t=38.495
lsn_current 3604430049  lsn_flushed 3603725140  os_log_written 5673106  t=38.897
Between the first two samples, os_log_written grew by 850,223 bytes. lsn_current, the end of the log including what is still in memory, grew by exactly 850,223 bytes. lsn_flushed did not move for those 0.418 s, and had moved by the third sample. On MariaDB 11.8 this counter tracks redo generated, not redo written.
The same comparison on MySQL does not line up. In the standalone rerun (the bench linked above; 3 s, writer thread on), the two counters grew by different amounts:
mysql   os_log_written   delta 2850816 bytes
mysql   lsn_current      delta 1522191 bytes
So on MySQL the counter is not the LSN. What it does count is left open in the limits section.
Second and third passes. MariaDB now reads Innodb_lsn_flushed; MySQL still reads Innodb_os_log_written:
db      mode                                      commit/s  jumps  gap p50   gap max  predicted loss/kill
mysql   =0 + sync_binlog=0                            3819    508    5.9ms     7.6ms     11
mysql   =0 + sync_binlog=0 + log_writer=OFF           2516      8  184.2ms   818.6ms    844
maria   flush_log_at_trx_commit=0                     2897      3 1001.7ms  1003.2ms   1363

mysql   =0 + sync_binlog=0                            2425    473    6.2ms    19.5ms      8
mysql   =0 + sync_binlog=0 + log_writer=OFF           2295      9  189.7ms   799.4ms    767
maria   flush_log_at_trx_commit=0                     2001      3 1002.6ms  1007.1ms    857
A matching number is not proof of cause, so I turned one knob and killed for real:
| predicted loss / kill | measured loss / kill | |
|---|---|---|
| MySQL, writer thread on | 8–11 | 6 / 5 = 1.2 (two runs, 6 each) |
MySQL, innodb_log_writer_threads=OFF | 767–844 | 2986 / 5 = 597, 3447 / 5 = 689 |
| MariaDB | 857–1363 | 9123 / 5 = 1825 |
The first row is off: MySQL with its writer thread lost about 7 to 9 times fewer commits than predicted, in the safe direction. The 5 ms sampling floor can only overstate its gaps, which fits. The other two rows match the prediction in order of magnitude. One variable took MySQL from 6 lost commits to 3,447: 575 times more.
Interpretation: who calls write()
innodb_flush_log_at_trx_commitdecides how far a commit waits, not when the log is written.1waits for fsync,2waits forwrite(),0waits for nothing.- MySQL 8 has dedicated log writer threads that move redo from the log buffer to the OS (
innodb_log_writer_threads, on by default). In these runs they show up as a write roughly every 6 ms, the probe’s floor. At=0the commit does not wait, but the writer runs only milliseconds behind it, so a process crash loses almost nothing. - MariaDB behaves as if it has no such thread. At
=0, redo waits for the once-a-second flush (innodb_flush_log_at_timeout=1). The bench prints the runtime settings:innodb_flush_method=O_DIRECTandinnodb_log_file_buffering=OFFon 11.8.9 (output). So the redo file bypasses the page cache:write()and reaching disk are one event, and that is whylsn_flushedis the right counter there.
Why MariaDB’s counter tracks generated bytes, I haven’t read its source, so I can’t say why. I only measured that it moves in lockstep with lsn_current.
Limits of this measurement
- kill -9 tests
write(), not fsync. Nothing here measures power loss. - MySQL’s counter is only half-checked. In the bench rerun on MySQL,
os_log_writtengrew 2,850,816 bytes while the LSN grew 1,522,191, so it does not count the LSN the way MariaDB’s does. I have not shown that it counts bytes actually written. I still rely on it for MySQL because the crash results agreed with the prediction, which is the same kind of trust that failed on MariaDB. On MySQL the counter also jumps more often than the LSN itself (495 vs 289 times in one bench run, 497 vs 295 in another); I can’t explain that. - One version each. The counter’s meaning is confirmed on MariaDB 11.8 only.
- Small samples on a noisy machine: five kills per mode, two or three passes, WSL2, 5 ms sampling floor.
- The MariaDB crash run is older than the probe. Its commit rate was not recorded in the same table, so the 1825 vs 857–1363 comparison is order-of-magnitude only.
Trade-offs
- One metric, one query per server: the correct counter differs between two servers that share a name and a lineage. Every dashboard query copied between them needs its own check.
lsn_flushedis right only whileO_DIRECTholds: with log file buffering turned on,write()and disk separate, and I expect this counter would then overstate the process-crash window. I did not test it.- The writer thread is not free in principle: it buys a small loss window on process death. I did not measure its CPU cost; with the writer off, commit/s went from 4194 in the first pass to 2516 in the second, a swing larger than the differences between modes, so these tables can’t answer it.
When this matters
- Read
flush_log_at_trx_commitas “how far a commit waits”. The real loss depends on the architecture underneath. - Ask separately about process death and power loss. OOM kills and containers killed by an orchestrator are the first kind; at
=0these two servers differ by orders of magnitude there. - Before graphing a counter on a server you haven’t checked, sample it by hand next to one you understand. Three lines were enough here.
I picked the measuring tool by its name, and only learned it counted something else because a second number I had measured could not be true at the same time.